


web, archival maps, NYC tax data (2014)
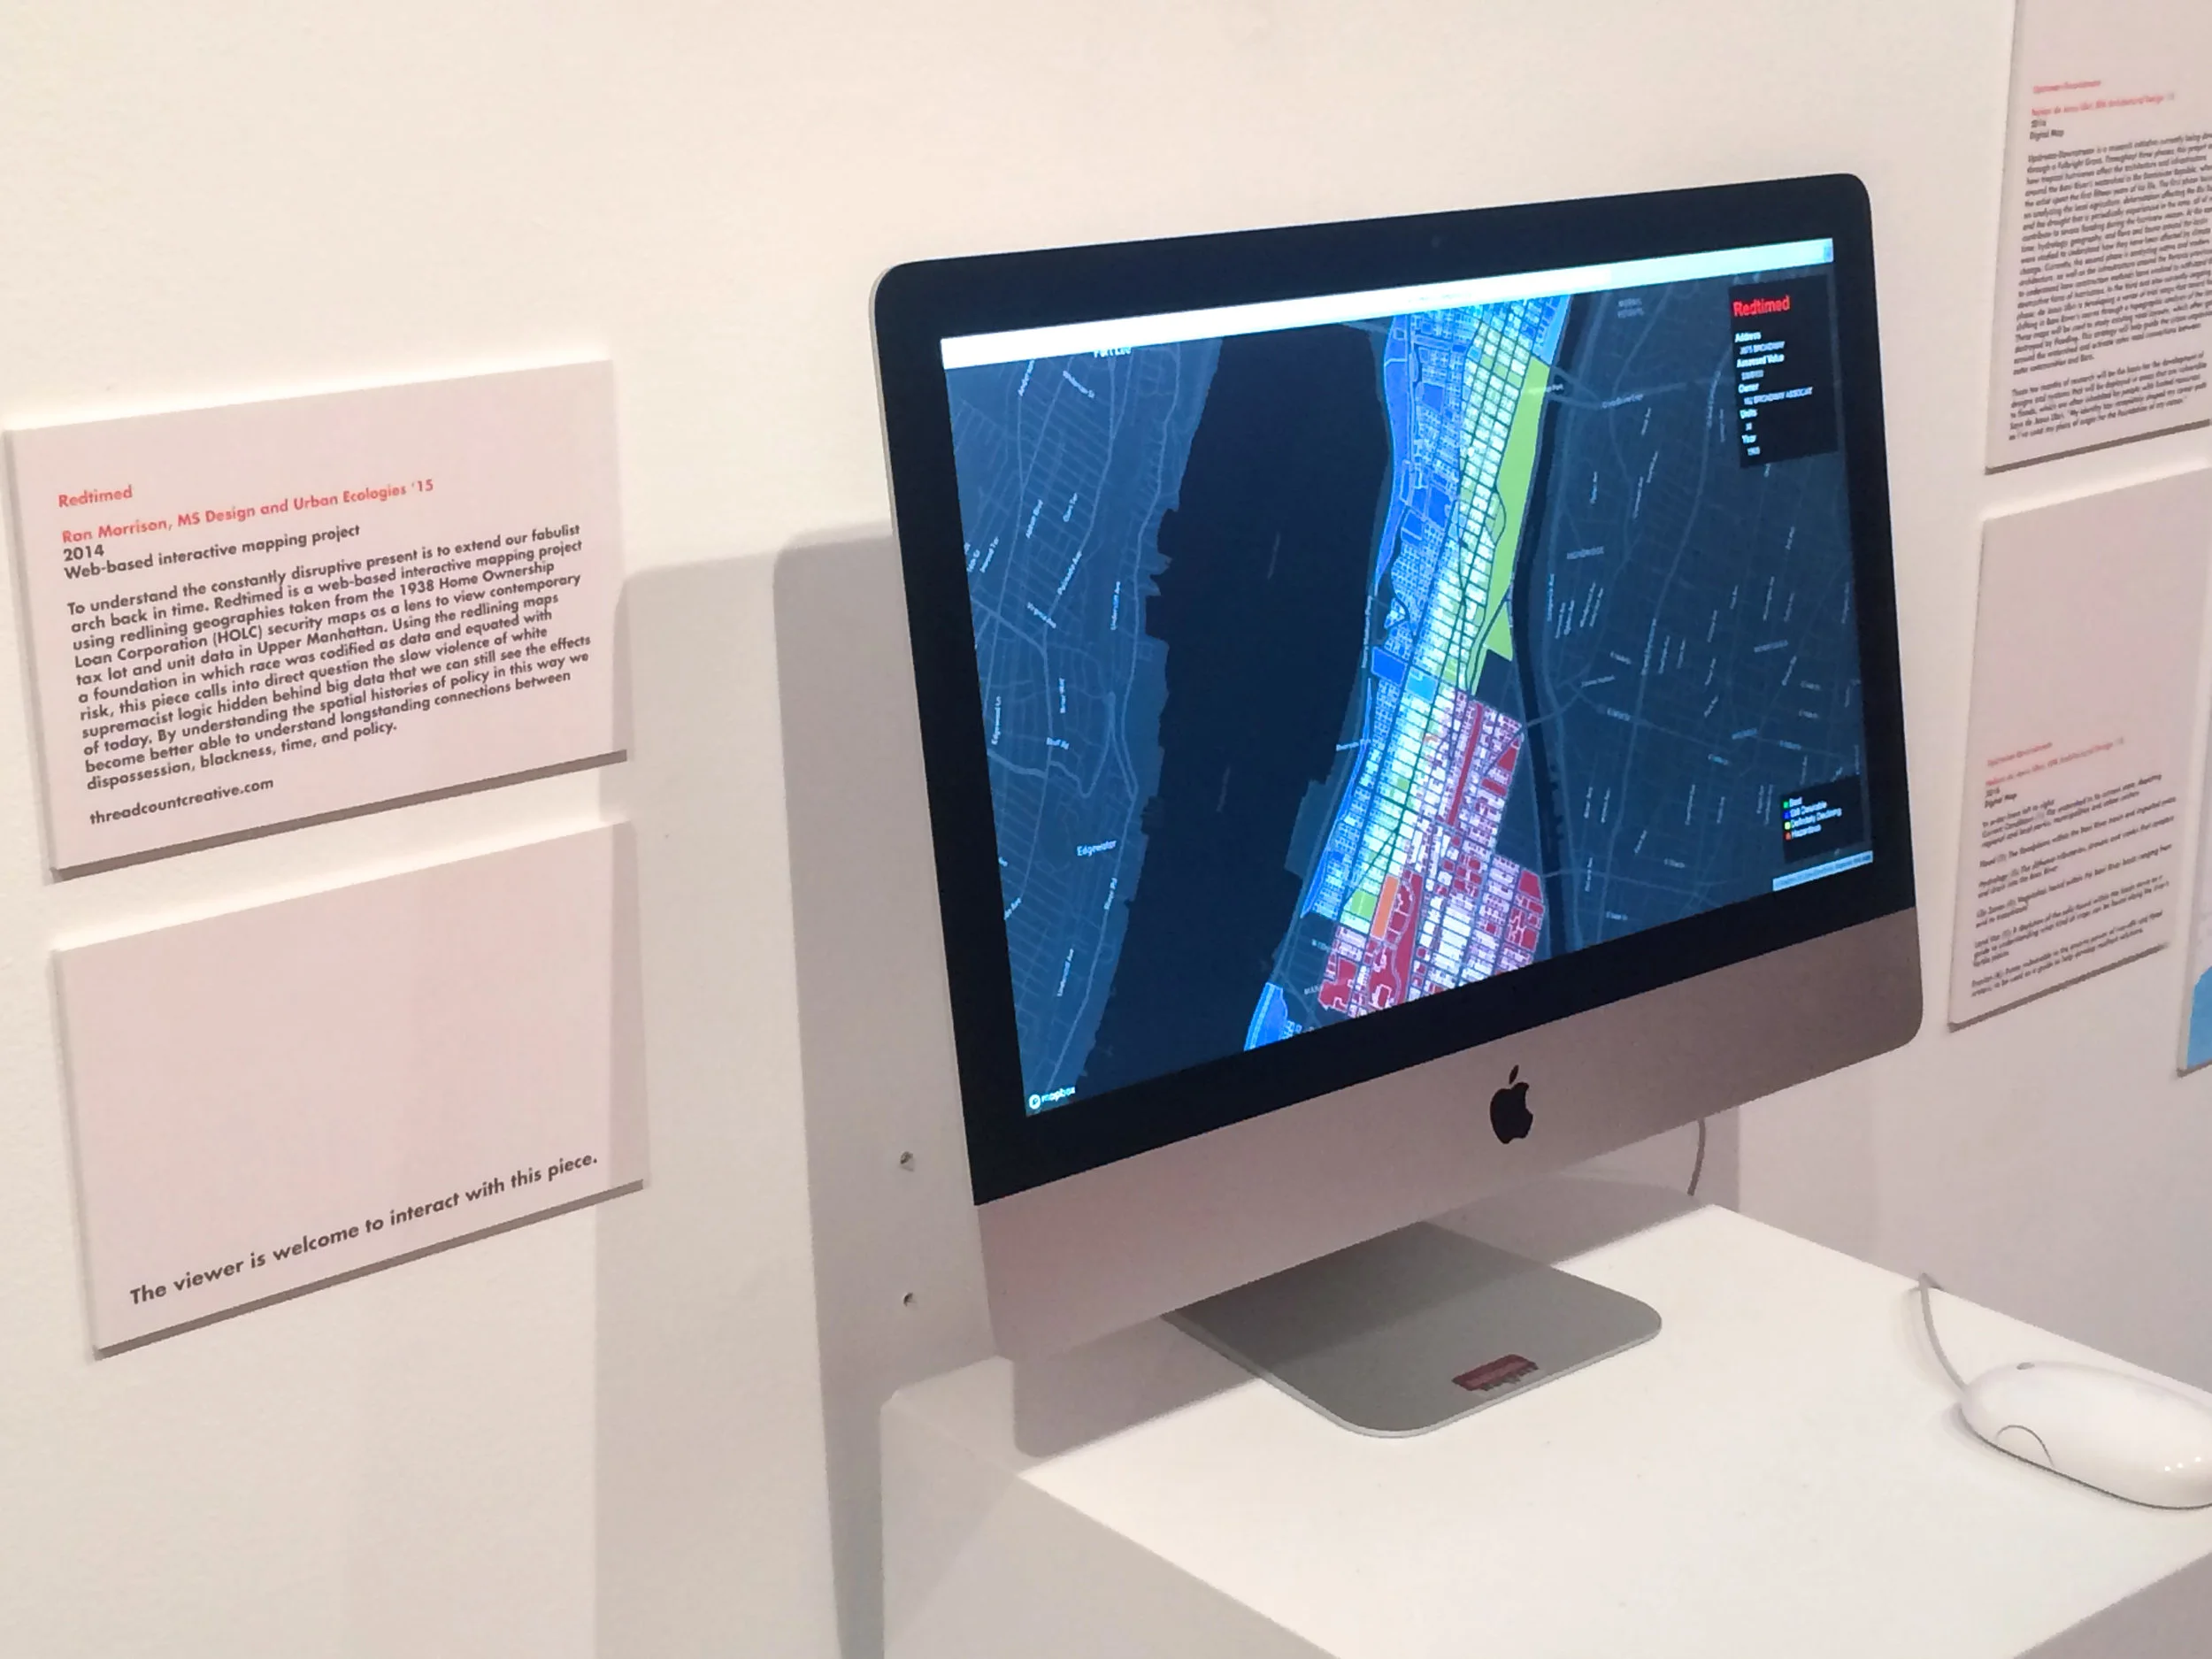
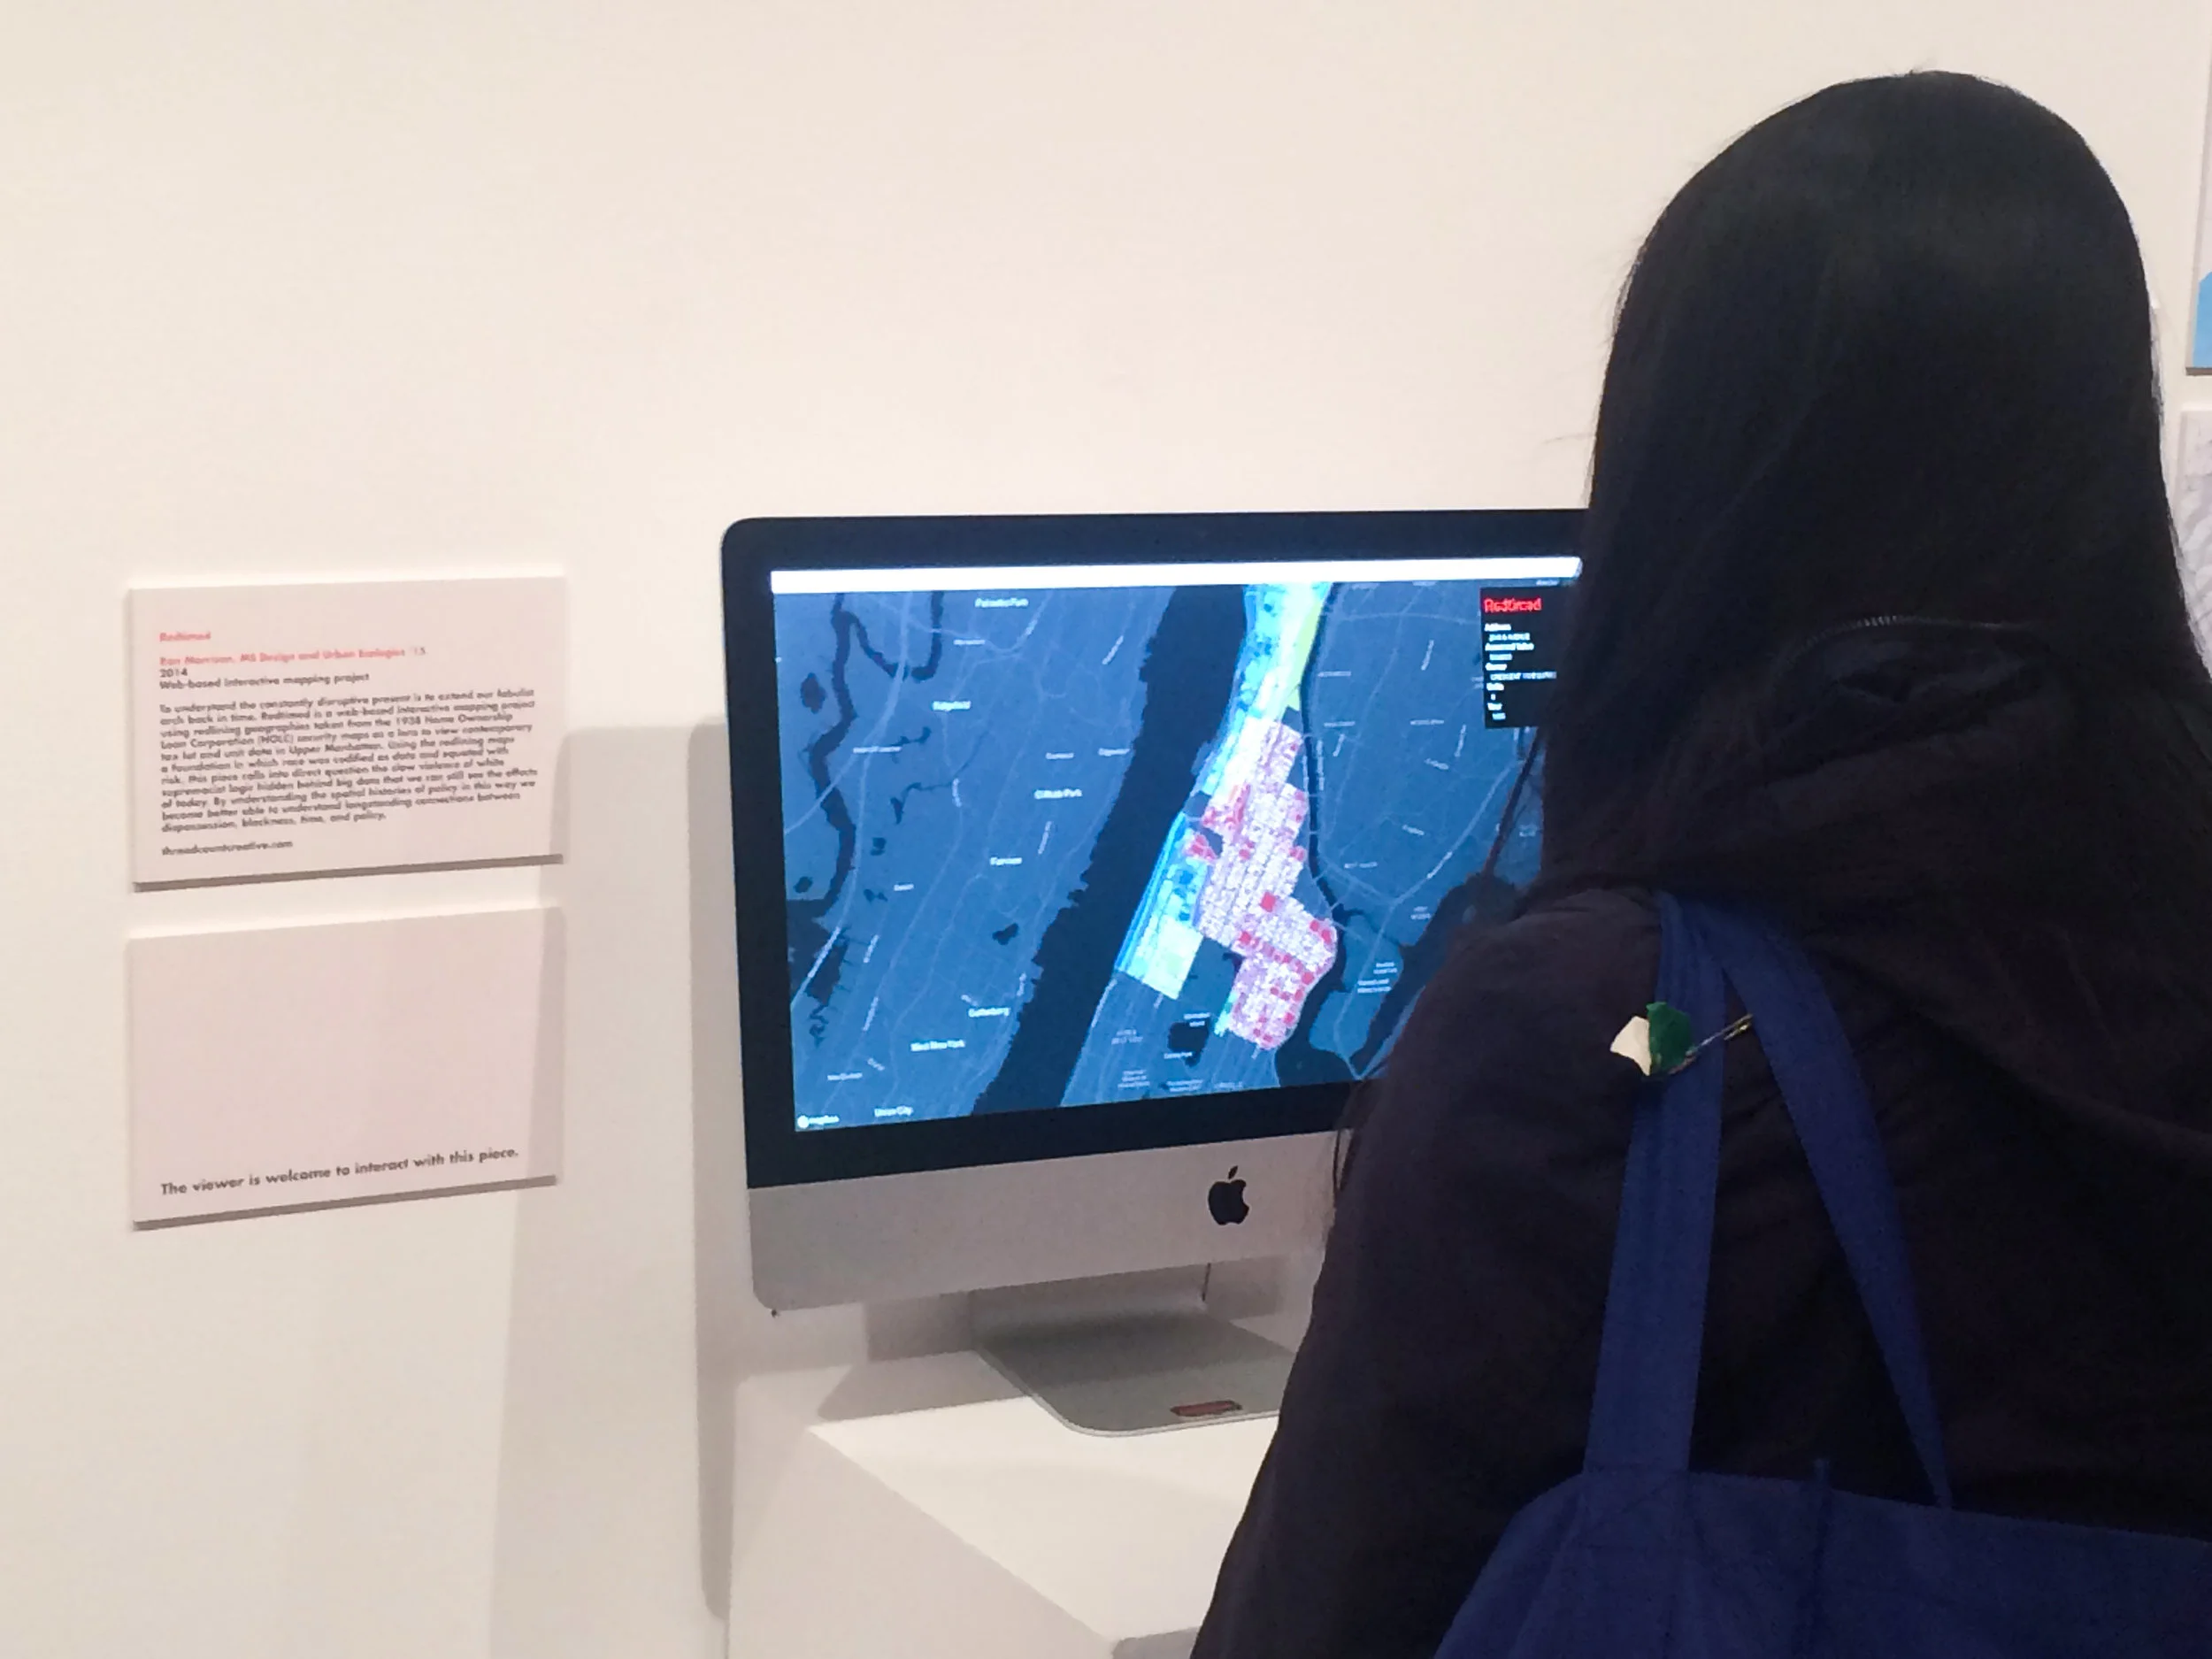
To understand the constantly disruptive present is to extend our fabulist arch back in time. Redtimed is a web-based interactive mapping project using redlining geographies taken from the 1938 Home Ownership Loan Corporation (HOLC) security maps as a lens to view contemporary tax lot and unit data in Upper Manhattan. This project is an ongoing experiment into the various visualities of "slow violence". Working from Rob Nixon's concept I am interested in the offerings of design and media making in visualizing "violence that is neither spectacular nor instantaneous but instead incremental, whose calamitous repercussions are postponed for years or decades or centuries." By understanding the racial and spatial histories of policy in this way we become better able to understand longstanding connections between displacement, inequity, race, and space. You can view the entire map here.